
Setting up an Exploration in Google Analytics 4 (GA4) is the best way to report on display ad performance when using Advanced Ads to serve digital ads.
While default reports in Google Analytics help you monitor basic analytics, explorations allow you to explore your data in depth, going beyond standard reports. For this exercise, we will be building a free-form exploration.
Setting Up a Custom Dimension
To use Google Analytics to track ad performance, a custom dimension must be set up that connects GA4 to the Advanced Ads plugin on your Indie Site.

You can set up a custom dimension on your GA4 account by going to Admin > Data Display > Custom Definitions and add the following:
- Dimension name: Advanced Ads
- Scope: Event
- Description: Advanced Ads event label
- Event parameter: event_label
Note: If the event parameter event_label is already taken, reach out to your Publisher Guide!
Update Tracking Settings in Advanced Ads
First, you must ensure that the tracking in Advanced Ads is set to GA4. To do this, you will need to find your GA4 Property ID.
Find Your Property ID in Google Analytics 4
To find the tracking ID for your Google Analytics 4 property, you will need to follow these steps:
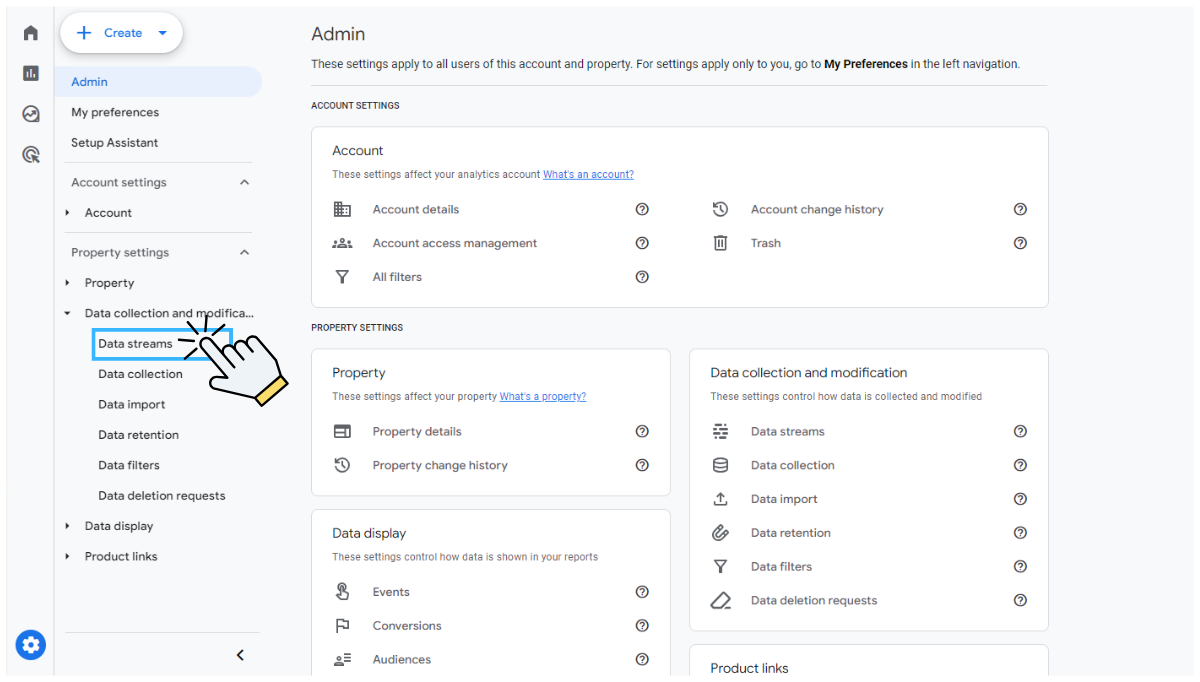
- Sign in to your Google Analytics account.
- Click on the Admin button in the bottom left corner of the page.
- Click on Property Settings to expand the menu and then click on Data Streams
- Click on the web data stream for which you want to find the property ID. This will open up the Web Stream Details window.
- The property ID is listed as Measurement ID. Copy this unique identifier for your property.

Update Advanced Ads Settings
Now you need to log into your Indie Site so you can update your tracking settings and add the GA4 property ID.

- Hover over Display Ads on the left navigation menu and select Settings.
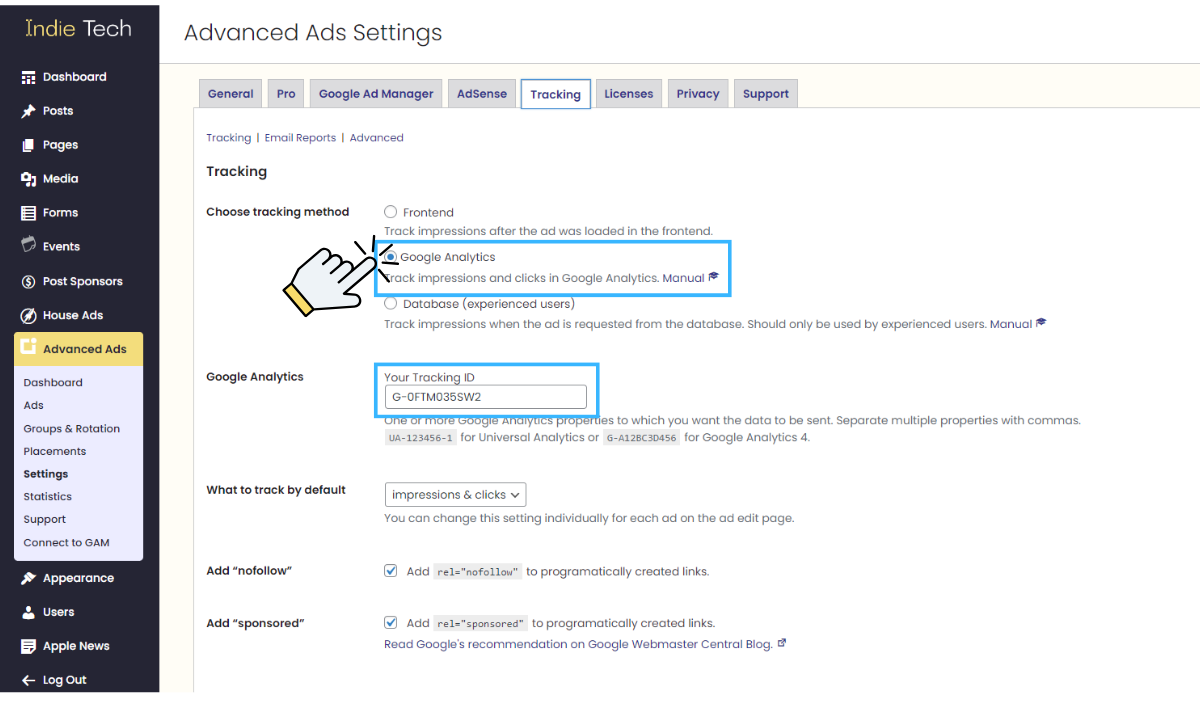
- Click on Tracking at the top of the settings page.
- Select Google Analytics as the tracking method.
- Enter the property ID you copied from GA4 into the Google Analytics Tracking ID field.
- Click Save at the bottom of the page.
Building an Exploration
Log into Google Analytics and navigate to the appropriate GA4 account and property.

- Expand the left-hand menu and select Explore
- Click the Blank option to create a new exploration
- Title your exploration “Display Ad Performance” or similar

You have now created your base exploration, but you will need to add dimensions, metrics, and segments. Under the variables section, provide the dimensions, metrics, and segments required for this exploration.
- Click the + beside Dimensions and select the following:
- Custom > Advanced Ads
- Event > Event Name
- Optional: Time > Month
- Click Import
- Once imported, click the Select Dimension button under Rows and include the variable for Advanced Ads
- Optional: You can also include Month, if you do this make sure you turn the Nested Rows option to Yes
- Click Select Dimension under Columns and include the variable for Event Name
- Click the + beside Metrics and select the following:
- User > Total User
- Click Import
- Once imported, click the Select Metric button under Values and include the variable for Total Users
Segmenting Your Exploration
To view ad performance metrics, you will need to build a Segment. A segment is a subset of your analytical data that can be used in Explorations. A segment you create or modify will only be available in the exploration in which you defined it.
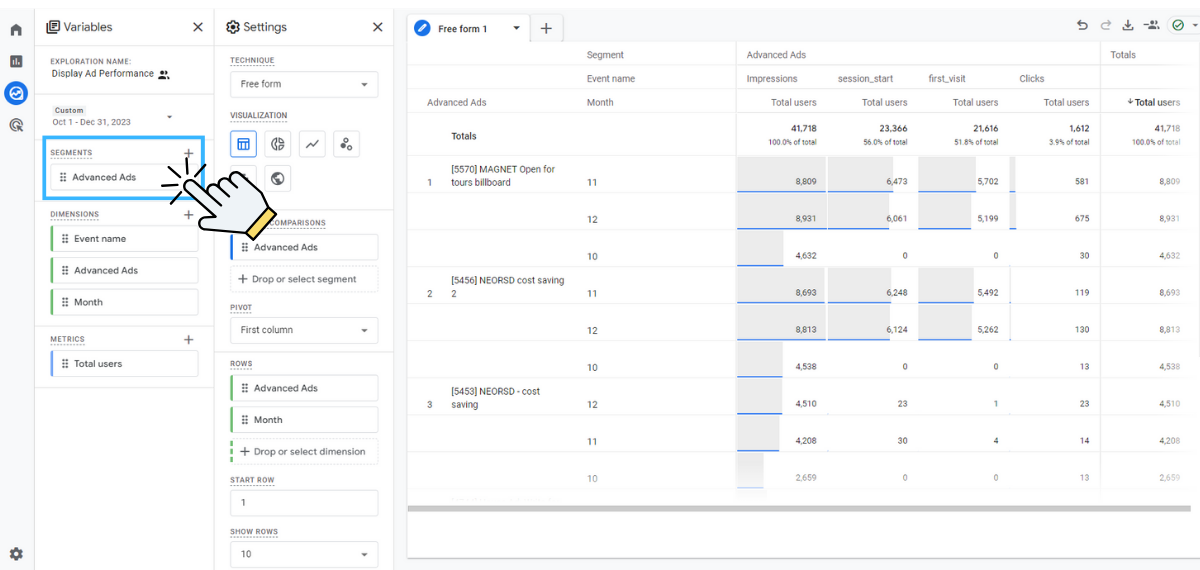
- Click the + to create a New Segment
- Select the Event Segment, the Segment Build window will appear
- Enter a name for the segment, i.e. Advanced Ads Segment
- Click Add New Condition to specify the selection criteria, in this case it will be Custom > Advanced Ads
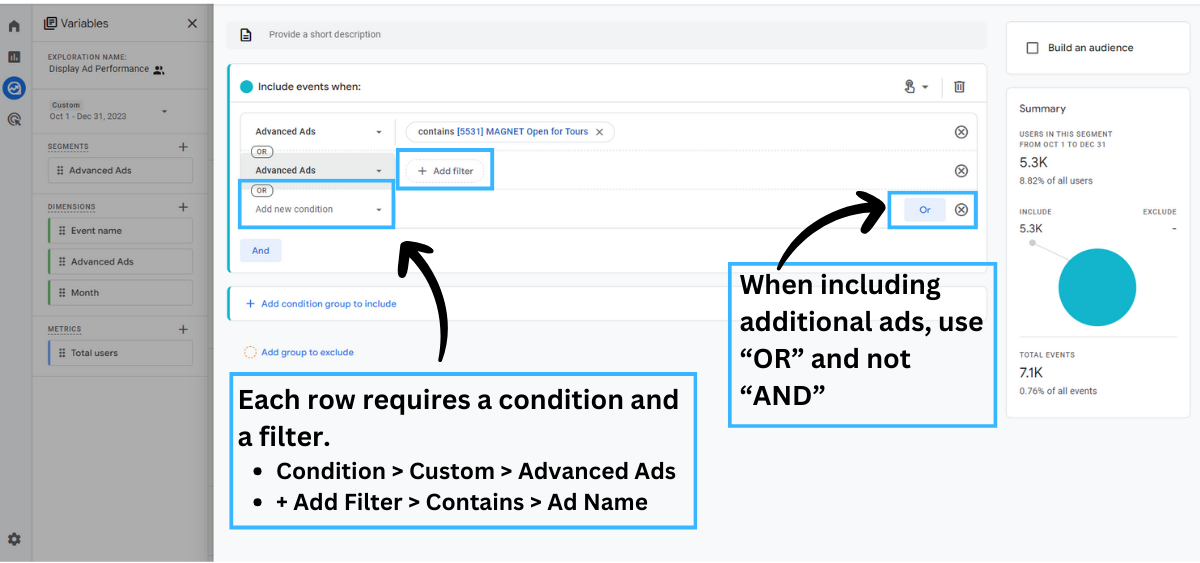
- Under Contains, start typing the name of the ad you want to report on
- If you have multiple ads you want to report on, click OR to add an additional line to the segment
- Click Save and your exploration will refresh
Note: The SAVE button will be grayed out until you enter at least one complete condition (i.e. both the Condition and Contains section are filled out).
Adjust the Time Frame
Explorations allow you to select a specific time frame to report on. To change the time frame of an exploration:
- At the top of Variables, click the currently selected date range
- Select a preset date range or use the calendar to select a custom range
- Click OK
Updating a Segment
Explorations are saved and can be run and modified as needed. Similar to the time frame above, you can adjust your segment to include new/different data. In Google Analytics, navigate to the existing Exploration that you want to modify.
- Open the Exploration
- Hover your cursor over the existing segment and click the three dots to the right
- Click Edit.
- A warning window will appear that says, “You are editing a segment. This segment is currently in use. Editing it will refresh the data in this exploration,” click Edit Segment
- Follow the steps under Segmenting Your Exploration to add new lines to your existing segment. You can also modify existing lines or delete them entirely.
Sharing An Exploration
When you first create an Exploration, only you can see it. You can share your insights with your colleagues by sharing the Exploration. To do so, in the upper right, click Share Exploration (you must have the Analyst role at a minimum to do this).
Note: Shared Explorations can be viewed, but not edited, by anyone who has the Viewer role to the property. In order to edit an Exploration, a user must duplicate or copy the shared Exploration.